Mental health prediction with low-signal data
How does the way we handle missing behavioral data change what a mental-health prediction model learns?
In brief
My contribution: gradient-boosted modeling and comparison of missing-data strategies, with Sanika Bapat and Dan Adler.
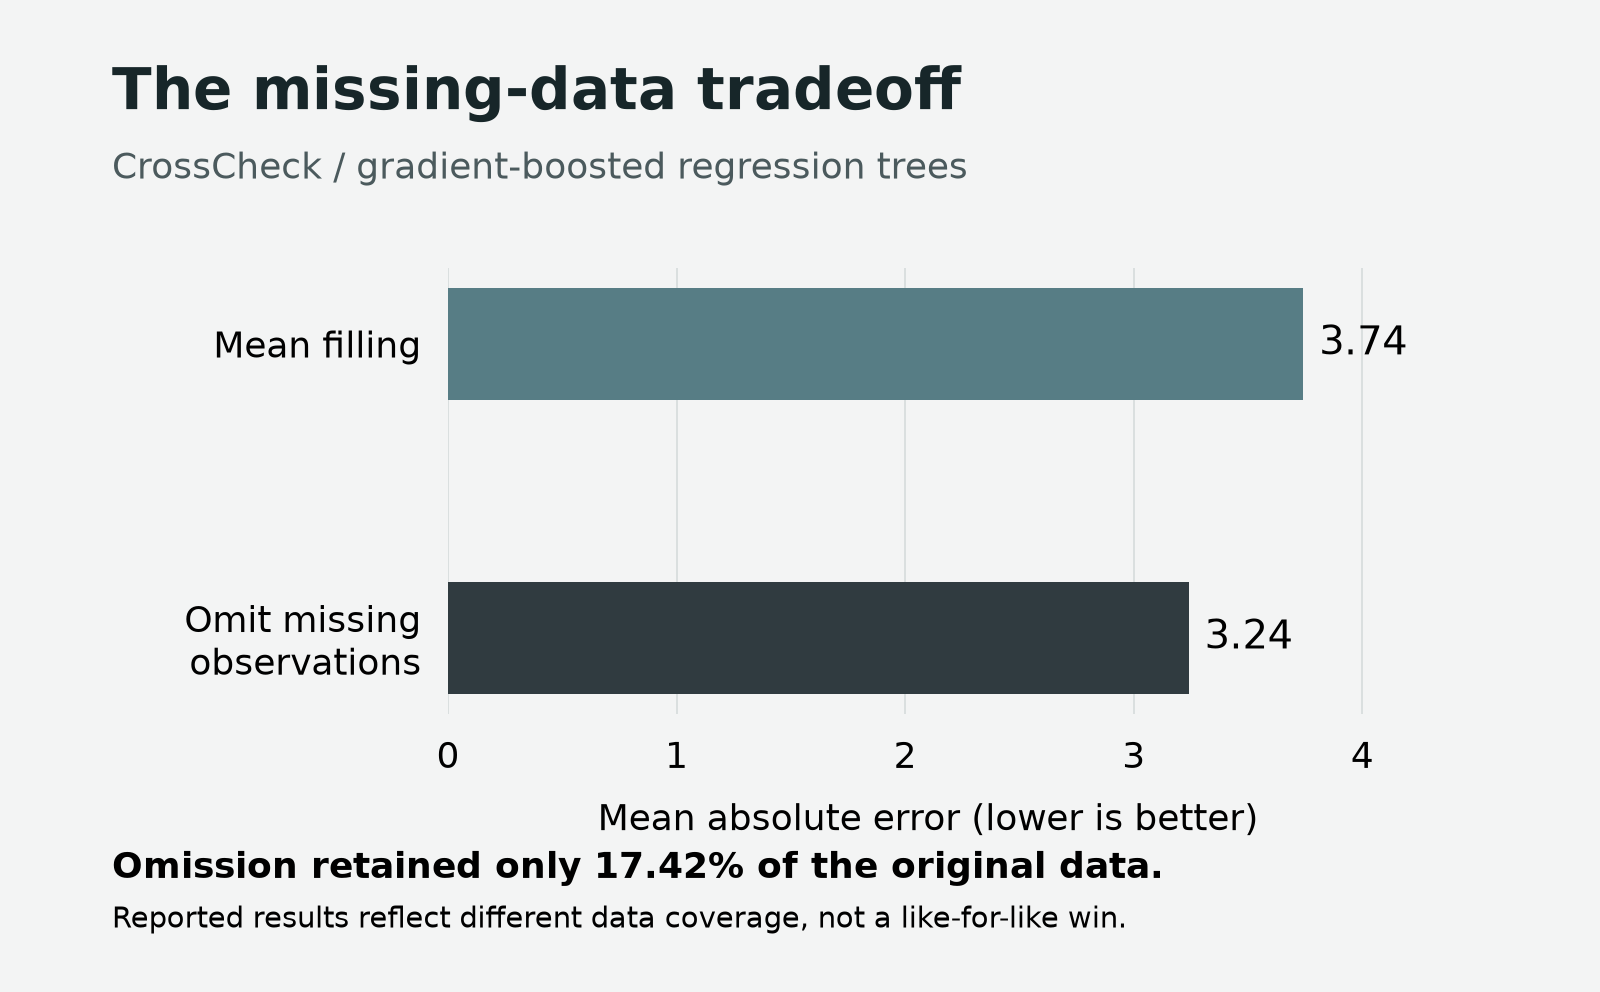
Finding: omission reduced reported MAE, but retained just 17.42% of the data. This is a completed research project, not a clinically validated model.
I used gradient-boosted regression trees to predict mental-health assessment scores from longitudinal CrossCheck data spanning 61 participants and 6,132 participant-days. Working with Sanika Bapat and Dan Adler, I compared missing-data strategies using mean absolute error (MAE) and R2.
The problem
Mobile sensing produces an incomplete picture of daily behavior. An absent reading is not necessarily an absence of activity. Filling in a gap and discarding it make different assumptions about the person behind the data.
The approach
Our pipeline derived 973 features from behavioral rhythms, including activity levels, rest-activity amplitude, variability, entropy, and power spectra. We considered historical windows from 2 to 14 days and modeled aggregate ecological momentary assessment (EMA) scores.
The preprocessing distinguished partially missing hours from hours with no recorded features. Partial gaps were filled with zero. We compared filling completely missing hours with participant- and hour-specific means against omitting them, then evaluated the resulting gradient-boosted models.
What the results mean
| Missing-data strategy | MAE | R2 |
|---|---|---|
| Mean filling | 3.74 | 0.300 |
| Omit completely missing observations | 3.24 | 0.486 |
The denominator is part of the result
MAE describes the observations that reached evaluation, not the observations removed before it. When preprocessing changes which observations survive, comparing headline scores alone mixes a modeling decision with a selection decision. Did the model improve, or are we measuring performance on a different slice of the data?
This does not prove that omission removed the hardest cases, or that mean filling was better. Neither conclusion follows from the available results. A method that predicts well only when data is relatively complete may be useful, but that is a narrower claim than working well under sparse sensing. Coverage belongs alongside error in the result.
Evaluation limits
The report does not specify a reproducible train/test split, whether participants were held out, or whether preprocessing statistics were fitted on training data only. It also does not document tuning settings or uncertainty estimates. These results therefore cannot establish generalization to new patients or a causal advantage for either missing-data strategy.
The next experiment I would run
I would first distinguish forecasting for a known person from generalizing to someone new. The former calls for time-aware separation; the latter calls for participant-level separation. Historical windows must not carry overlapping information across the chosen boundary.
- Fix the evaluation population. Compare errors on a common set of eligible observations, and report each strategy's wider coverage separately. An unavailable prediction must not count as an accurate one.
- Fit preprocessing within training. Estimate filling statistics using only information available at prediction time, including a defined fallback for someone with no usable history.
- Keep a simple baseline. Use a training-derived constant or historical-score baseline with the same eligibility rules.
- Inspect variation. Report error and coverage by participant and missingness level, with uncertainty that respects repeated observations within a person.
This is a proposed follow-up, not a result of the original project. The intended use, split, preprocessing assumptions, eligible population, number of predictions, error, and baseline should appear together so readers can distinguish better predictions from a change in who receives one.
The follow-up draws on scikit-learn's data leakage guidance and grouped and time-dependent cross-validation.
Download the two reported aggregate results (CSV).
Project context
This is a summary of a Cornell Tech research project, not a peer-reviewed publication or a clinically validated diagnostic tool. The target was self-reported assessment scores, not a diagnosis.