Modeling neural activity with learned features
Can a model better describe neural activity by learning combinations of movement, sensory cues, and context?
With Nakul Yadav and Gregory Ghahramani, I compared four ways of modeling recorded neural activity. We used 940 neurons across 5,845 timepoints, paired with 15 task and movement features. This was an analysis of existing recordings from mice performing a virtual-reality behavioral task, not a clinical prediction tool.
The modeling question
A neuron's response may depend on a combination of events rather than one cue alone. For example, movement in one context might be associated with a different response than the same movement in another. We asked whether models that combine inputs could capture patterns missed by treating each feature as an independent contribution.
What goes into the model?
The inputs describe sensory cues, reinforcement events, and behavior such as speed, acceleration, and licking. The target is a fluorescence signal associated with neural activity. Think of this measurement as an afterglow: a calcium indicator's signal fades over time rather than switching off immediately after an event. The models need to account for that timing, not just whether an event happened.
Four approaches
- Linear regression: scale the inputs and learn a weight for each feature. This provides a simple baseline.
- Decay-convolved regression: give each event a fading trace before fitting the model, approximating the indicator's afterglow.
- Polynomial regression: add pairwise combinations of those features so the model can represent interactions, not just separate effects.
- A convolutional neural network (CNN): learn patterns across features and time, then map them to a predicted signal with a neural-network readout.
The CNN used 40-frame windows to estimate activity at the 30th frame. Because the window includes information after the target frame, this is retrospective modeling, not forecasting future activity. The report calls this model "CNN-GLM"; the archived implementation includes nonlinear hidden layers in the readout.
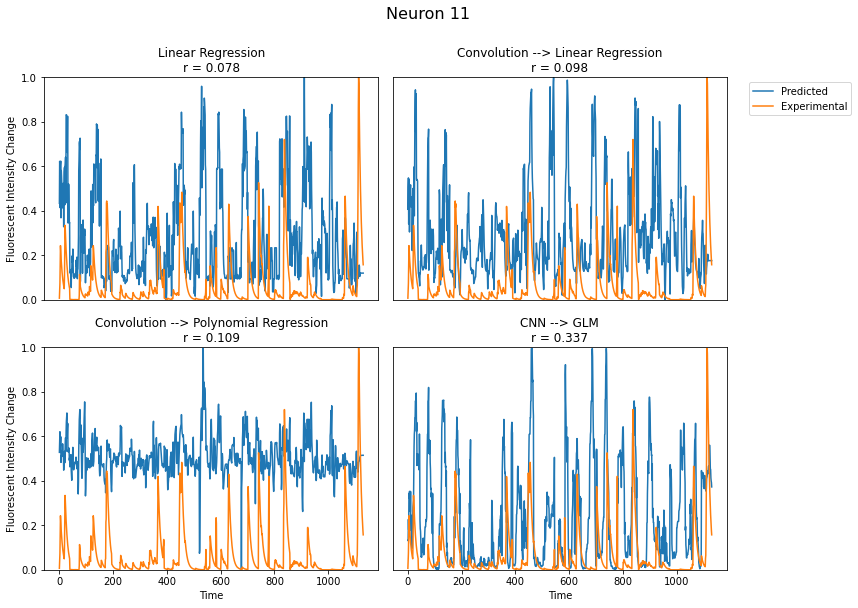
What the comparison showed
We measured Pearson correlation between predicted and recorded signals for each neuron. It asks whether the two traces rise and fall together, not whether their values match exactly. The original report counted neurons above a correlation of r = 0.05:
| Model | Count |
|---|---|
| Linear regression | 561 |
| Decay-convolved regression | 556 |
| Polynomial regression | 493 |
| CNN-based model | 675 |
The CNN had the highest count in this analysis, while adding polynomial interactions did not improve that count. More features were not automatically better. These are historical report results, not a fresh reproduction; the low correlation cutoff is a descriptive threshold, not a statistical significance test or an accuracy score.
Which inputs did the model rely on?
We removed groups of related features, such as movement or reward-context cues, and retrained the model. This is called feature ablation. Like removing an ingredient and making the recipe again, it asks how much the outcome changes without that ingredient. Here, the outcome was correlation with the recorded signal.
A drop suggests that the group helped the model predict the signal. It does not establish that the feature caused the neural response: correlated inputs can substitute for one another, and a change in correlation is not a fraction of explained variance.
Evaluation limits
The original split assigned the first 160 points of each 200-point block to training and the remaining 40 to validation. Overlapping input windows can share observations across that boundary, making validation less independent than it appears. A stronger follow-up would hold out whole time blocks or recording sessions, leave a gap between windows, and repeat training to assess variability. The project demonstrates a modeling comparison and an approach to probing learned features, not a validated account of how the brain works.